In my last post, we looked at tensors and how they act as the memory of a machine learning model. Today, I want to talk about the “scorecard” that tells the model whether it’s actually getting better or just guessing wildly. This is called the Loss Function.
The Dartboard Analogy
Imagine you’re throwing darts at a board. You remember exactly how you threw the dart (the angle, the speed, the release), but there’s one big problem: you don’t know where the bullseye is.
If you can’t see the target, you can never get better. You might throw a dart and hit the wall, but without knowing how far you were from the center, you have no way to adjust your next throw. The loss is simply a single number that represents the distance between your guess and the perfect bullseye.
Visualizing the Learning Process
To see this in action, I used the TensorFlow Playground, which is a great tool for visualizing how a model classifies data.
When you first start a model, it’s neutral. It doesn’t know which areas are “blue” and which are “orange.” It usually starts with a “failing grade” of around 0.5 loss. As the model runs through “epochs” (which are just loops of training), you can see the colors on the screen becoming more crisp and defined. This means the loss is dropping, and the model is becoming more confident.
The Problem with Learning Too Fast
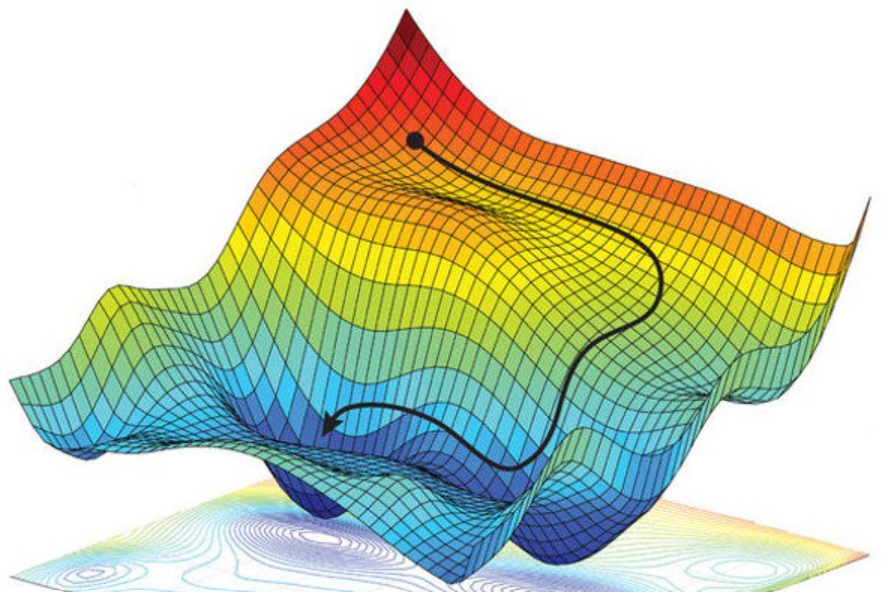
You might think we should just set the “learning rate” to the maximum so the model learns instantly. However, if a model learns too fast, the math can become “explosive.”
The numbers start getting too large and stop making sense. It’s better to start with a moderate learning rate so the model can smoothly find the right “shape” for the data rather than overshooting the target and crashing.
How the Math Collapses
As data travels through a neural network, it passes through different layers. I like to think of the neurons in these layers as “radio knobs.”
The input data (like coordinates on a graph) gets multiplied and shifted by these knobs. Eventually, all that complex math collapses down into a single number: the loss.
- We take the model’s prediction.
- We subtract the actual correct answer.
- We take the “absolute value” (because we only care how far off we were, not if we were too high or too low).
- We average those errors across all the data points to get one final score.
The Rewind Button
Because tensors remember their history, we can hit a “rewind button” called backwards. This carries that error score back through every single operation and identifies which specific “knob” or weight was responsible for the mistake.
In the next part of this series, we’ll look at exactly how the model turns those knobs to fix itself and win the game of making perfect predictions.
Check out the interactive tool mentioned in the video: TensorFlow Playground
Let me know what you think in the comments, and stay tuned for the next video in this series!